When AI Meets KPIs: Turning Metrics into Intelligence

AI-powered analytics is shifting measurement from a backward-looking exercise into a strategic decision engine, enabling marketers to understand behavior, predict outcomes, and continuously improve performance.
Why Traditional KPIs Are No Longer Enough
Digital marketing generates enormous amounts of data, yet many teams still rely on surface-level KPIs such as click-through rate (CTR), conversion rate, cost per acquisition (CPA), or last-click attribution. These metrics are easy to report, easy to compare, and increasingly misleading.
The problem is not that traditional KPIs are wrong. It is that they no longer explain performance.
Most Teams Do Not Lack Data. They Lack Context
A typical customer journey today rarely looks linear.
A user sees a social ad, returns via organic search days later, reads a blog post, clicks an email, and finally converts through paid search.
If we reward only the last click, we are not measuring performance. We are simplifying it.
Many teams have cut content budgets because “SEO does not convert,” while paid search appears to be the hero, even though search demand often exists only because of content earlier in the journey.
AI forces marketers to confront this reality by making the full journey visible.
Rethinking Our Relationship With KPIs
Clicks, sessions, conversion rate, and cost per acquisition still matter. They describe what is happening at a surface level. However, they are no longer where analysis should stop.
The real value now lies in understanding how sequences of interactions influence these metrics over time. AI-powered analytics does not replace traditional KPIs; rather, it transforms them into starting signals rather than final answers. AI analytics provides the context behind these metrics, explaining why they change and identifying which customer journeys truly create value.
When Connecting Data Changes the Story
One of the biggest shifts AI enables is connection.
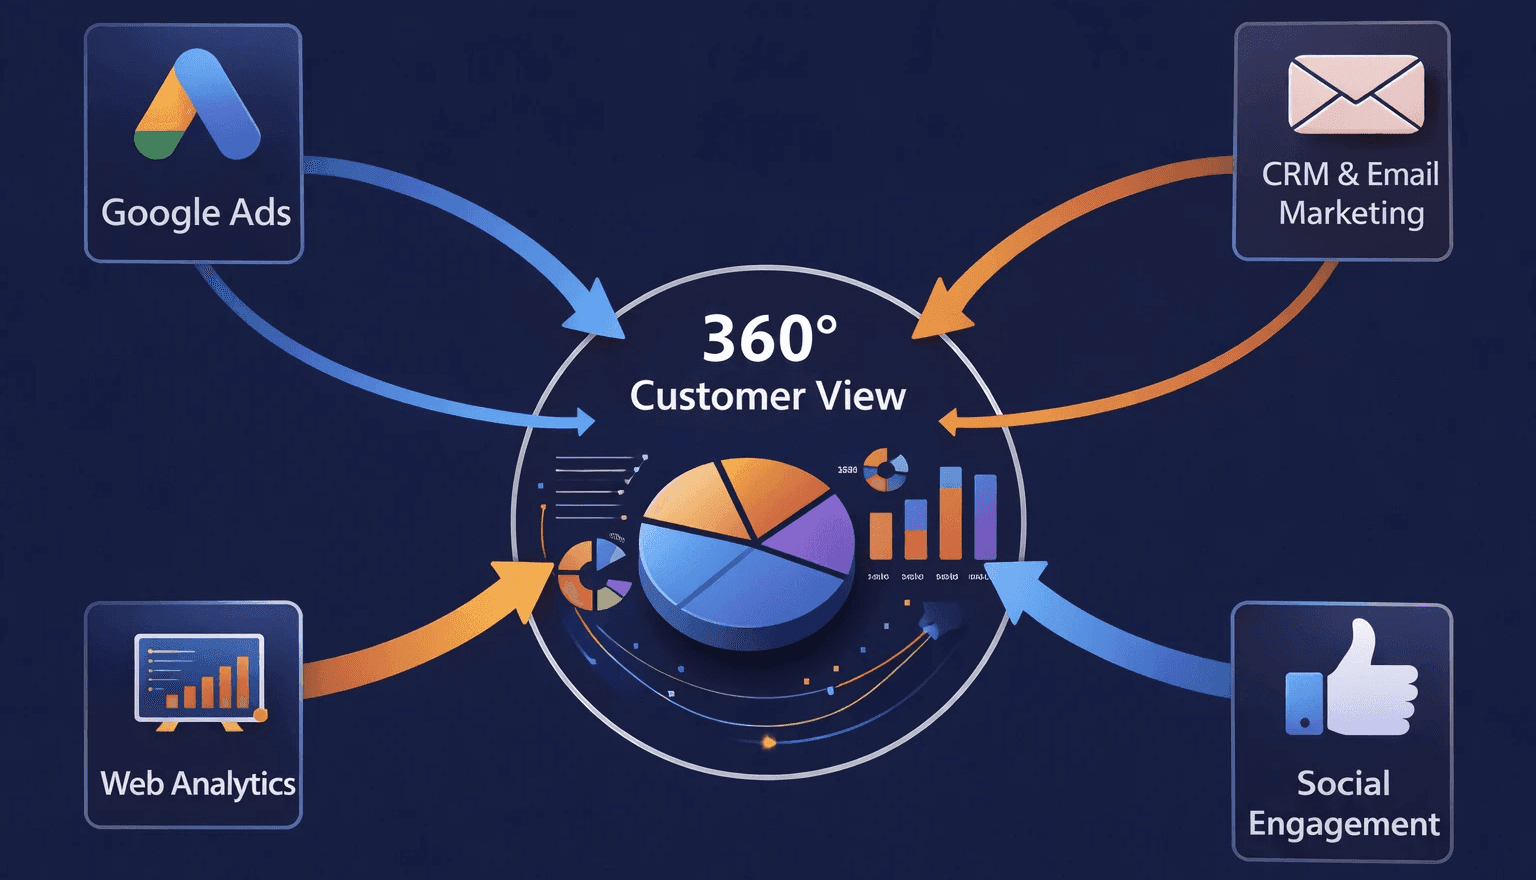
Modern customer journeys are fragmented across multiple platforms and channels. Analyzing any single channel in isolation often leads to distorted conclusions. AI-driven analytics addresses this challenge by integrating data from diverse sources, including advertising platforms, web analytics tools, CRM systems, email platforms, and social engagement data.
By unifying these inputs, marketers gain a 360° view of the customer journey, revealing how channels influence one another rather than competing for credit.
Why Channel-Level Attribution Breaks Down
Last-click attribution falls short because customer journeys are rarely linear.
As customers engage across multiple channels and touchpoints, assigning full credit to the final interaction oversimplifies how value is created. Early- and mid-journey interactions meaningfully influence outcomes, even when they do not directly drive the final conversion.
AI-driven attribution models analyze the sequence of touchpoints, the timing between interactions, and their relative impact. Rather than relying on rigid rules, they identify and learn from patterns observed across customer journeys.
This shift goes beyond improving reporting. It fundamentally changes how performance is interpreted and where investment decisions are made. Instead of optimizing isolated channels, teams evaluate contribution across the entire customer journey.
Measuring Performance Across the Customer Journey
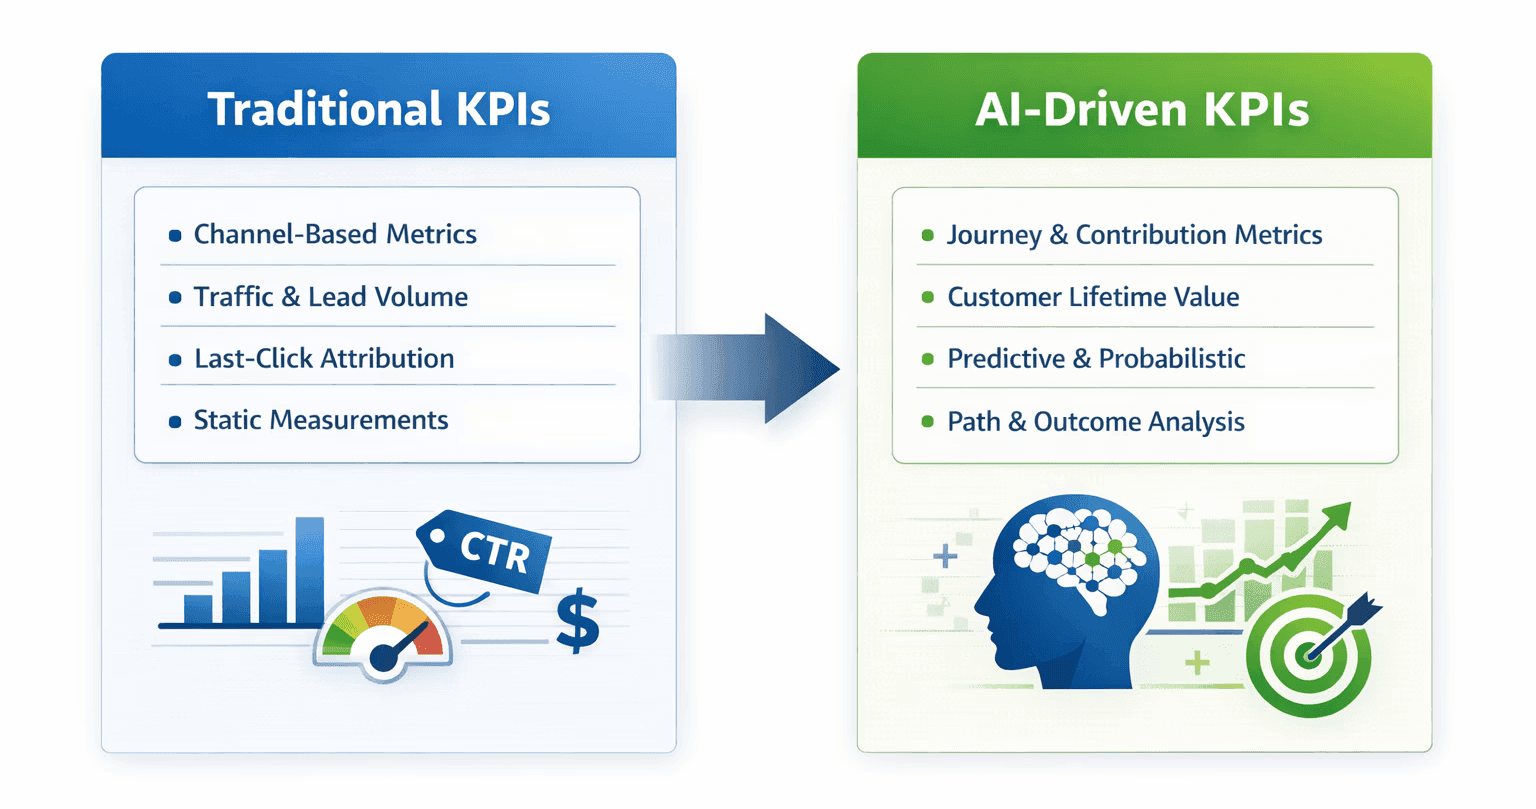
From Channel KPIs to Journey KPIs
Traditional channel-level KPIs answer questions such as which channel converted or which campaign performed best.
More mature KPIs, however, reflect the full customer journey and each touchpoint’s contribution along the path. These include metrics such as assisted conversion value, incremental lift by journey sequence, and conversion probability by journey type.
The focus shifts from “which channel performed?” to “which path created value?”
From Volume Metrics to Quality and Value Metrics
As AI-driven analytics and modeling mature, measurement shifts away from scale alone and toward quality and long-term value. Metrics such as customer lifetime value, retention probability, revenue per user or cohort, and cost per incremental outcome offer a more accurate view of sustainable performance.
This shift reduces the risk of optimizing for activity rather than outcomes that meaningfully drive the business, a concern echoed in recent industry discussions on rethinking KPIs and measuring what truly matters.
From Static KPIs to Predictive Indicators
Historically, KPIs were deterministic. A conversion either occurred or it did not. A channel either received credit or it did not.
Modern analytics introduces probability-based indicators that account for uncertainty and future outcomes. Examples include likelihood to convert, likelihood to churn, and expected future value.
These KPIs support forecasting, risk management, and forward-looking decision-making, rather than focusing solely on historical reporting.
Example of a KPI Transition
Conversion Contribution Value
This metric measures the contribution of early interactions, such as content engagement, to eventual conversion, rather than assigning credit solely to the final touchpoint.
A unified view of the customer journey often reveals patterns such as:
"Users who first interacted with a specific educational blog topic, often discovered via organic search or social, and who later returned through search, were significantly more likely to convert than users who followed other paths."
"Users who converted without ever engaging with that particular content still purchased, but at a lower rate and with weaker downstream signals."
The early content interaction influenced the performance of every subsequent channel. The critical factor was not how many clicks the blog post generated in isolation, but the sequence in which interactions occurred.
Rethinking Engagement as a KPI
Engagement rate remains but is no longer a stand-alone success KPI. As analytics matures, engagement KPIs evolve toward measures that explicitly link engagement to outcomes.
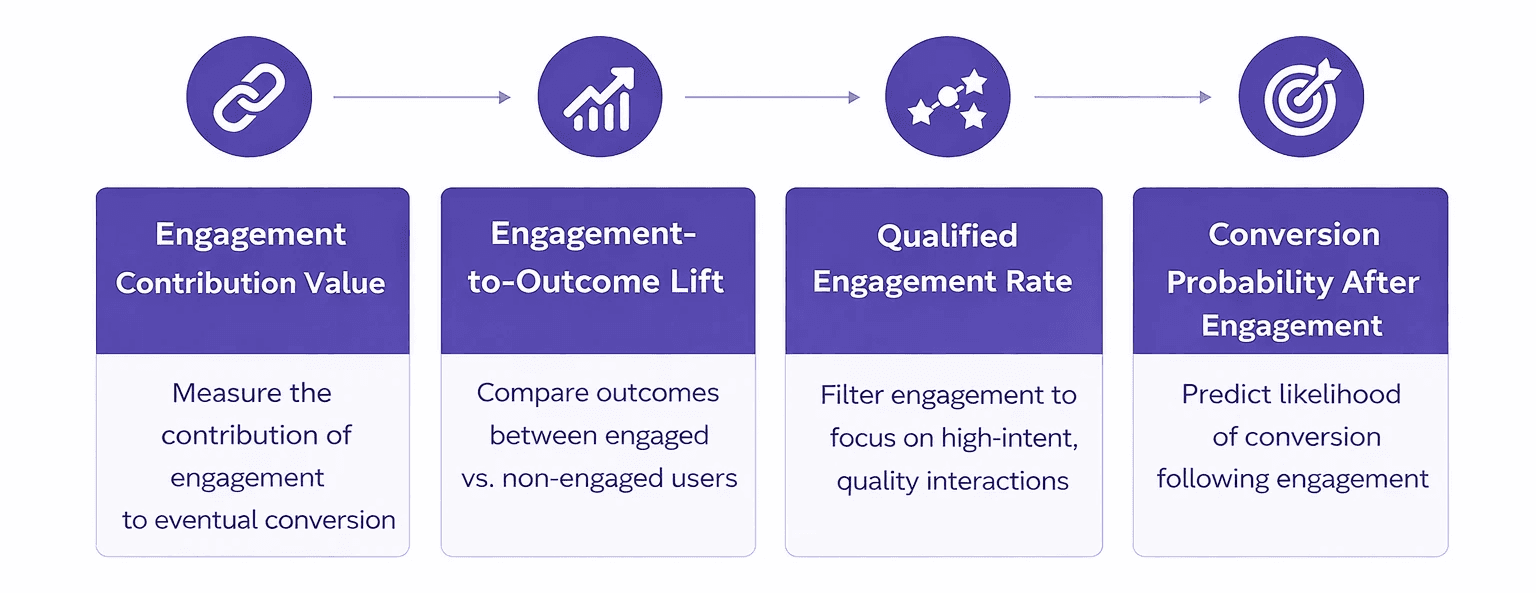
Engagement Contribution Value
Measures whether and how engagement with content increases downstream conversion probability or value.
Engagement-to-Outcome Lift
Compares conversion or retention outcomes between users who engaged and users who did not, shifting engagement measurement from activity to impact.
Qualified Engagement Rate
Measures engagement only when it meets defined criteria such as time spent, depth of interaction, sequence position, or repeat engagement.
Conversion Probability After Engagement
Estimates the likelihood of conversion following specific engagement events or content interactions. This is where AI-enabled analytics adds the most value.
These measurements go beyond simple reporting. They represent strategic intelligence.
Why Analytics Works Differently Today
Path analysis, funnels, sequences, attribution, and even machine learning all existed long before the current AI moment.
What has changed is not the existence of these techniques, but how they are applied. Machine learning has moved from an occasional analytical method to a continuously operating layer inside modern analytics systems.
These systems analyze millions of interactions continuously, comparing journeys, behaviors, and outcomes in parallel. Patterns surface not because the system is creative, but because it performs constant comparison at a level no human analyst could sustain manually.
Previously, insight depended heavily on human intervention. Analysts had to decide what to test in advance, build queries and explorations manually, and rerun analyses repeatedly, often constrained by sampling and time limits.
Today, machine learning operates continuously within analytics platforms. Unusual patterns and deviations are flagged automatically, attribution and prediction are likelihood-based rather than rule-driven, and sequence-level insight becomes accessible rather than theoretical.
This shift did not happen overnight. It unfolded gradually over the last five years, as machine learning moved from an optional capability to a foundational layer in modern analytics systems.
An Important Caveat: Constraints and Limitations
AI-powered attribution does not operate without friction. Privacy regulations, consent requirements, and the deprecation of third-party cookies all limit the data available for modeling, meaning some journeys are partially or entirely invisible to the model.
In data-sparse environments such as new markets or low-traffic channels, outputs become less reliable, and because attribution models can be opaque, it is not always easy to audit why a channel is being credited or discounted.
Used well, these tools sharpen judgment. Used uncritically, they can launder flawed assumptions with a layer of algorithmic confidence.
The Takeaway
Analytics is evolving into systems that surface insight proactively, optimize continuously, and adapt campaigns in near real time.
As this happens, the marketer’s role shifts from execution to judgment, from reporting to interpretation, and from operating tools to directing strategy.
AI does not replace human judgment. It raises the standard for it. Competitive advantage now depends less on data volume or tooling, and more on how insight is questioned, understood, and turned into action.
Annex
From Traditional KPIs to AI-Enabled KPIs
A consolidated comparison of traditional KPIs and AI-enabled alternatives is included below for reference.
Traditional KPI | What It Measures | Limitation | AI-Enabled KPI | What Changes | Strategic Question Answered |
Conversion Rate by Channel | % of users converting per channel | Disregards assist & sequence impacts | Conversion Contribution Value | Evaluates early interactions' impact on conversions | Which interactions actually influenced conversion |
Last-Click Attribution | Final touchpoint before conversion | Over-credits closing channels | Incremental Lift by Journey Sequence | Compares outcomes between users who followed different paths | Which paths create incremental value |
Engagement Rate | Volume of clicks, scrolls, or interactions | Assesses activity rather than overall impact | Engagement Contribution Value | Links engagement to downstream outcomes | Did engagement change future behavior |
Page Views / Time on Page | Content consumption volume | High volume does not equal intent | Qualified Engagement Rate | Filters engagement by depth, intent, and position in journey | Which engagement actually matters |
Cost per Lead (CPL) | Cost to acquire a lead | Treats all leads as equal | Expected Value by Journey Cohort | Weighs lead by predicted value | Which leads are worth investing in |
Static Conversion Rate | Binary outcome | No forward-looking insight | Conversion Probability After Engagement | Predicts likelihood of future conversion | Where to focus next actions |
Retention Rate (Historical) | Past churn behavior | Reactive | Churn Probability | Predictive signal | Who is at risk before churn occurs |
Share on LinkedIn


